token burn dashboard · build guide
Build your own token burn dashboard
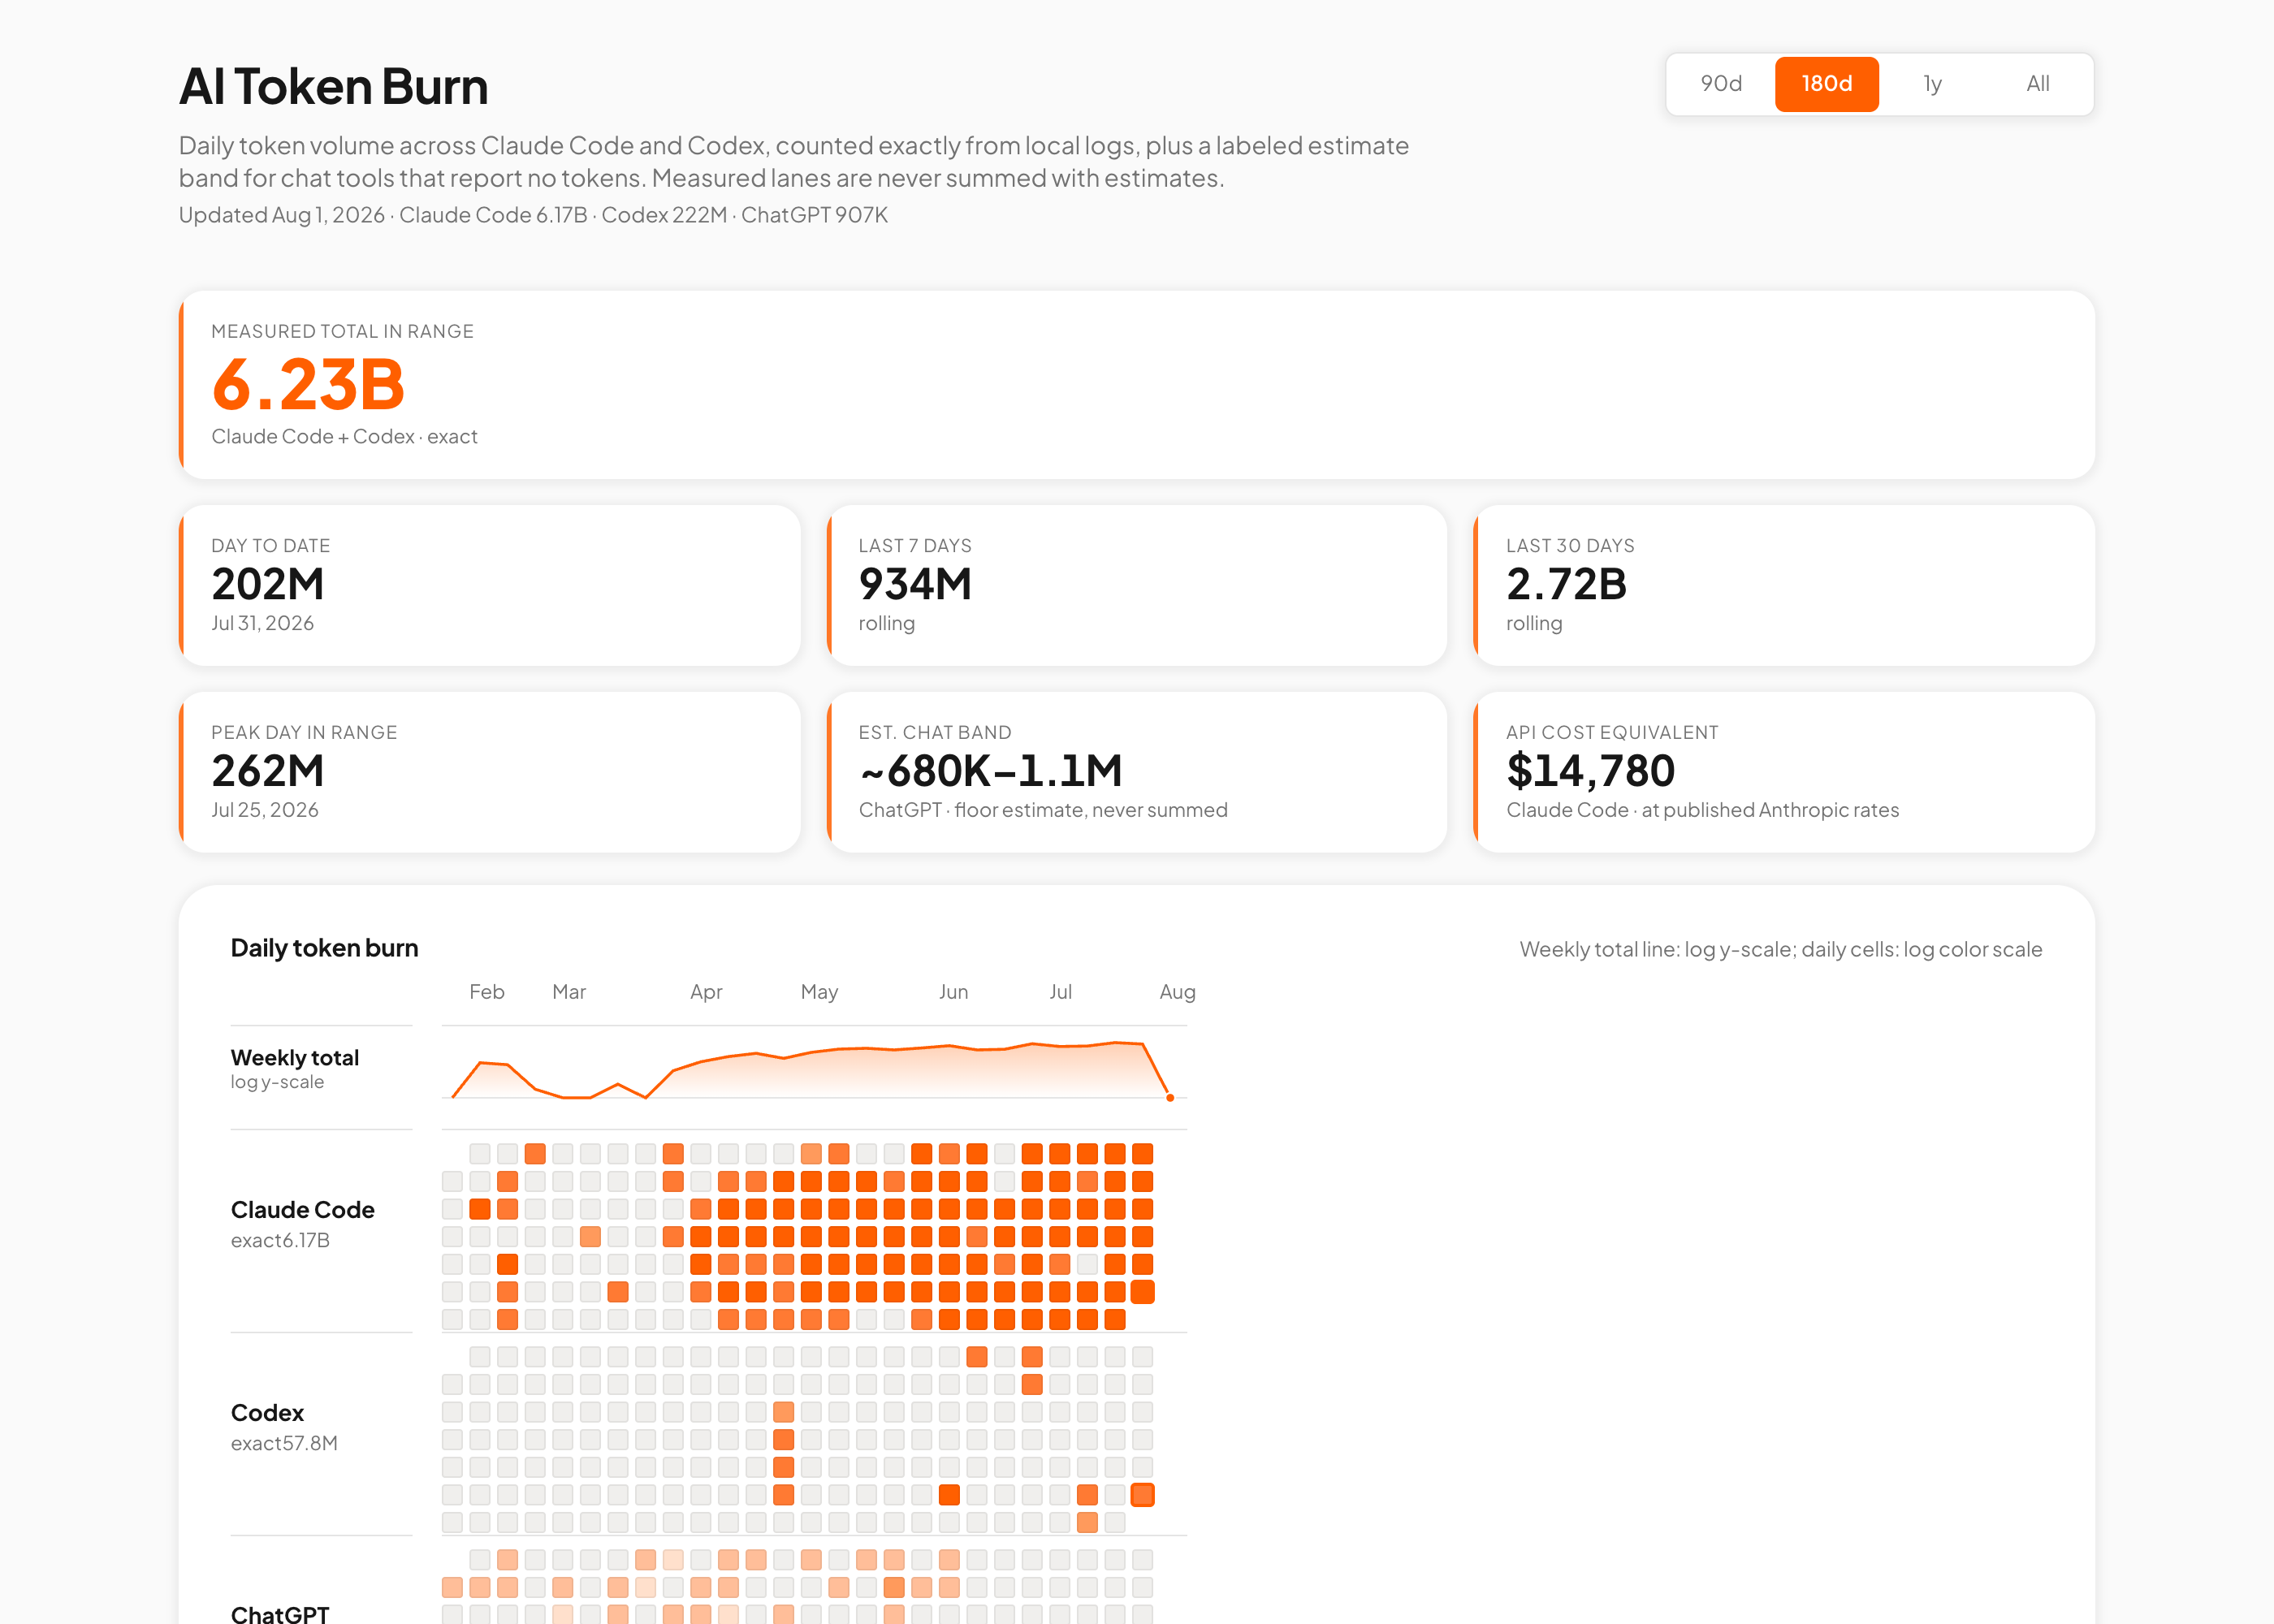
Four steps to a daily view of your own AI usage across Claude Code, Codex, and ChatGPT - exact counts where your tools actually report them, and an honestly labeled estimate where one doesn’t.
Why this exists, and what auditing my own AI delegation actually revealed → read the full newsletter post.
what you’ll build
A small daily tracker, three lanes wide. Claude Code and Codex both write local logs with real token counts in them, so those two lanes read exact numbers straight off your own disk. ChatGPT exposes no token data anywhere, so that lane counts what it actually can (conversations or messages) and turns it into a labeled estimate band instead of a number dressed up to look precise. No frameworks required - reading JSON lines off disk and adding numbers up is the whole job.
step 1 of 4
Find your local usage logs
Claude Code writes one JSONL file per conversation under ~/.claude/projects/<project>/*.jsonl. Each line is one event; the lines that matter carry a usage object with input_tokens, output_tokens, cache_creation_input_tokens, and cache_read_input_tokens. Codex writes one file per session under ~/.codex/sessions/<year>/<month>/<day>/rollout-*.jsonl, and the lines that matter are token-count events, nested three levels down at payload.info.total_token_usage with a total_tokens field - it’s already a running cumulative total for that session, so the last occurrence in the file is all you need.
$ find ~/.claude/projects -name "*.jsonl" | head -3
/Users/you/.claude/projects/-Users-you-myapp/f8c2ab18-....jsonl

$ find ~/.codex/sessions -name "rollout-*.jsonl" | head -3
/Users/you/.codex/sessions/2026/06/11/rollout-2026-06-11T13-28-55-....jsonl
Roughly what a line looks like in each (both field sets checked directly against real local log files while writing this):
// Claude Code line (shape)
{"timestamp":"2026-08-01T09:14:22Z","message":{"usage":
  {"input_tokens":3497,"output_tokens":131,
   "cache_creation_input_tokens":21923,"cache_read_input_tokens":0}}}

// Codex line (shape) - nested under payload.info, not top-level
{"type":"event_msg","payload":{"type":"token_count","info":
  {"total_token_usage":
    {"input_tokens":3571,"cached_input_tokens":3072,
     "output_tokens":171,"total_tokens":3742}}}}
step 2 of 4
Sum tokens per day, per tool
Walk both directories, parse each line as JSON, and bucket by day. For Claude Code, use each line’s own timestamp and add up the four usage fields. For Codex, the session’s date is already in its folder path or filename, and you only need the last total_token_usage.total_tokens per file - summing every line would double-count, since it’s a running total, not a per-turn delta. Keep the two running totals separate for now; you’ll want a clean measured-only combined number later, and it should never touch what ChatGPT reports.
// pseudocode - adapt to whatever language you're comfortable in
const claudeCodeByDay = {};
for (const file of walk("~/.claude/projects", "*.jsonl")) {
  for (const line of readLines(file)) {
    const event = JSON.parse(line);
    const usage = event?.message?.usage;
    if (!usage) continue;
    const day = event.timestamp.slice(0, 10);
    const tokens = usage.input_tokens + usage.output_tokens
      + usage.cache_creation_input_tokens + usage.cache_read_input_tokens;
    claudeCodeByDay[day] = (claudeCodeByDay[day] ?? 0) + tokens;
  }
}

const codexByDay = {};
for (const file of walk("~/.codex/sessions", "rollout-*.jsonl")) {
  const day = dayFromPath(file); // the path already has year/month/day
  let last = null;
  for (const line of readLines(file)) {
    const event = JSON.parse(line);
    const info = event?.payload?.info;
    if (info?.total_token_usage) last = info.total_token_usage;
  }
  if (last) codexByDay[day] = (codexByDay[day] ?? 0) + last.total_tokens;
}
step 3 of 4
For ChatGPT, count what you can - then label it an estimate
ChatGPT gives you no token counts anywhere - not in the app, not in a data export. Don’t fake precision it can’t give you. Export your data (Settings → Data controls → Export) and you get a conversation history with timestamps and messages, no tokens. Count what’s actually there - conversations or messages per day - and turn that into a low/high estimate band using two different tokens-per-message assumptions, rather than one invented number that looks as precise as the measured lanes. Which exact multipliers you pick matters far less than the number always carrying an “estimated” label everywhere it appears.
// pseudocode
const messagesPerDay = countMessages(chatgptExport, day);
const chatgptEstimate = {
  low: messagesPerDay * LOW_TOKENS_PER_MESSAGE,
  high: messagesPerDay * HIGH_TOKENS_PER_MESSAGE,
  label: "estimated", // never "measured" - this is the whole point
};
// keep this as its own object. it never gets added into
// claudeCodeByDay or codexByDay.
step 4 of 4
Render three lanes - and never sum them into one
The simplest version is a table: one row per day, three columns - Claude Code, Codex, ChatGPT (estimated). Give the ChatGPT column something visually different - a dashed border, an asterisk, a different label style - so a reader’s eye doesn’t mistake it for the same kind of number as the other two. If you want a combined “measured total,” only add Claude Code and Codex together. Never fold the ChatGPT estimate into that total, and never show a grand total that pretends it did. A bar chart or heatmap is a nice upgrade later, but the table already gets the one rule that matters right: a measured number and an estimated number can sit side by side, and they can never share a sum.
See it in action
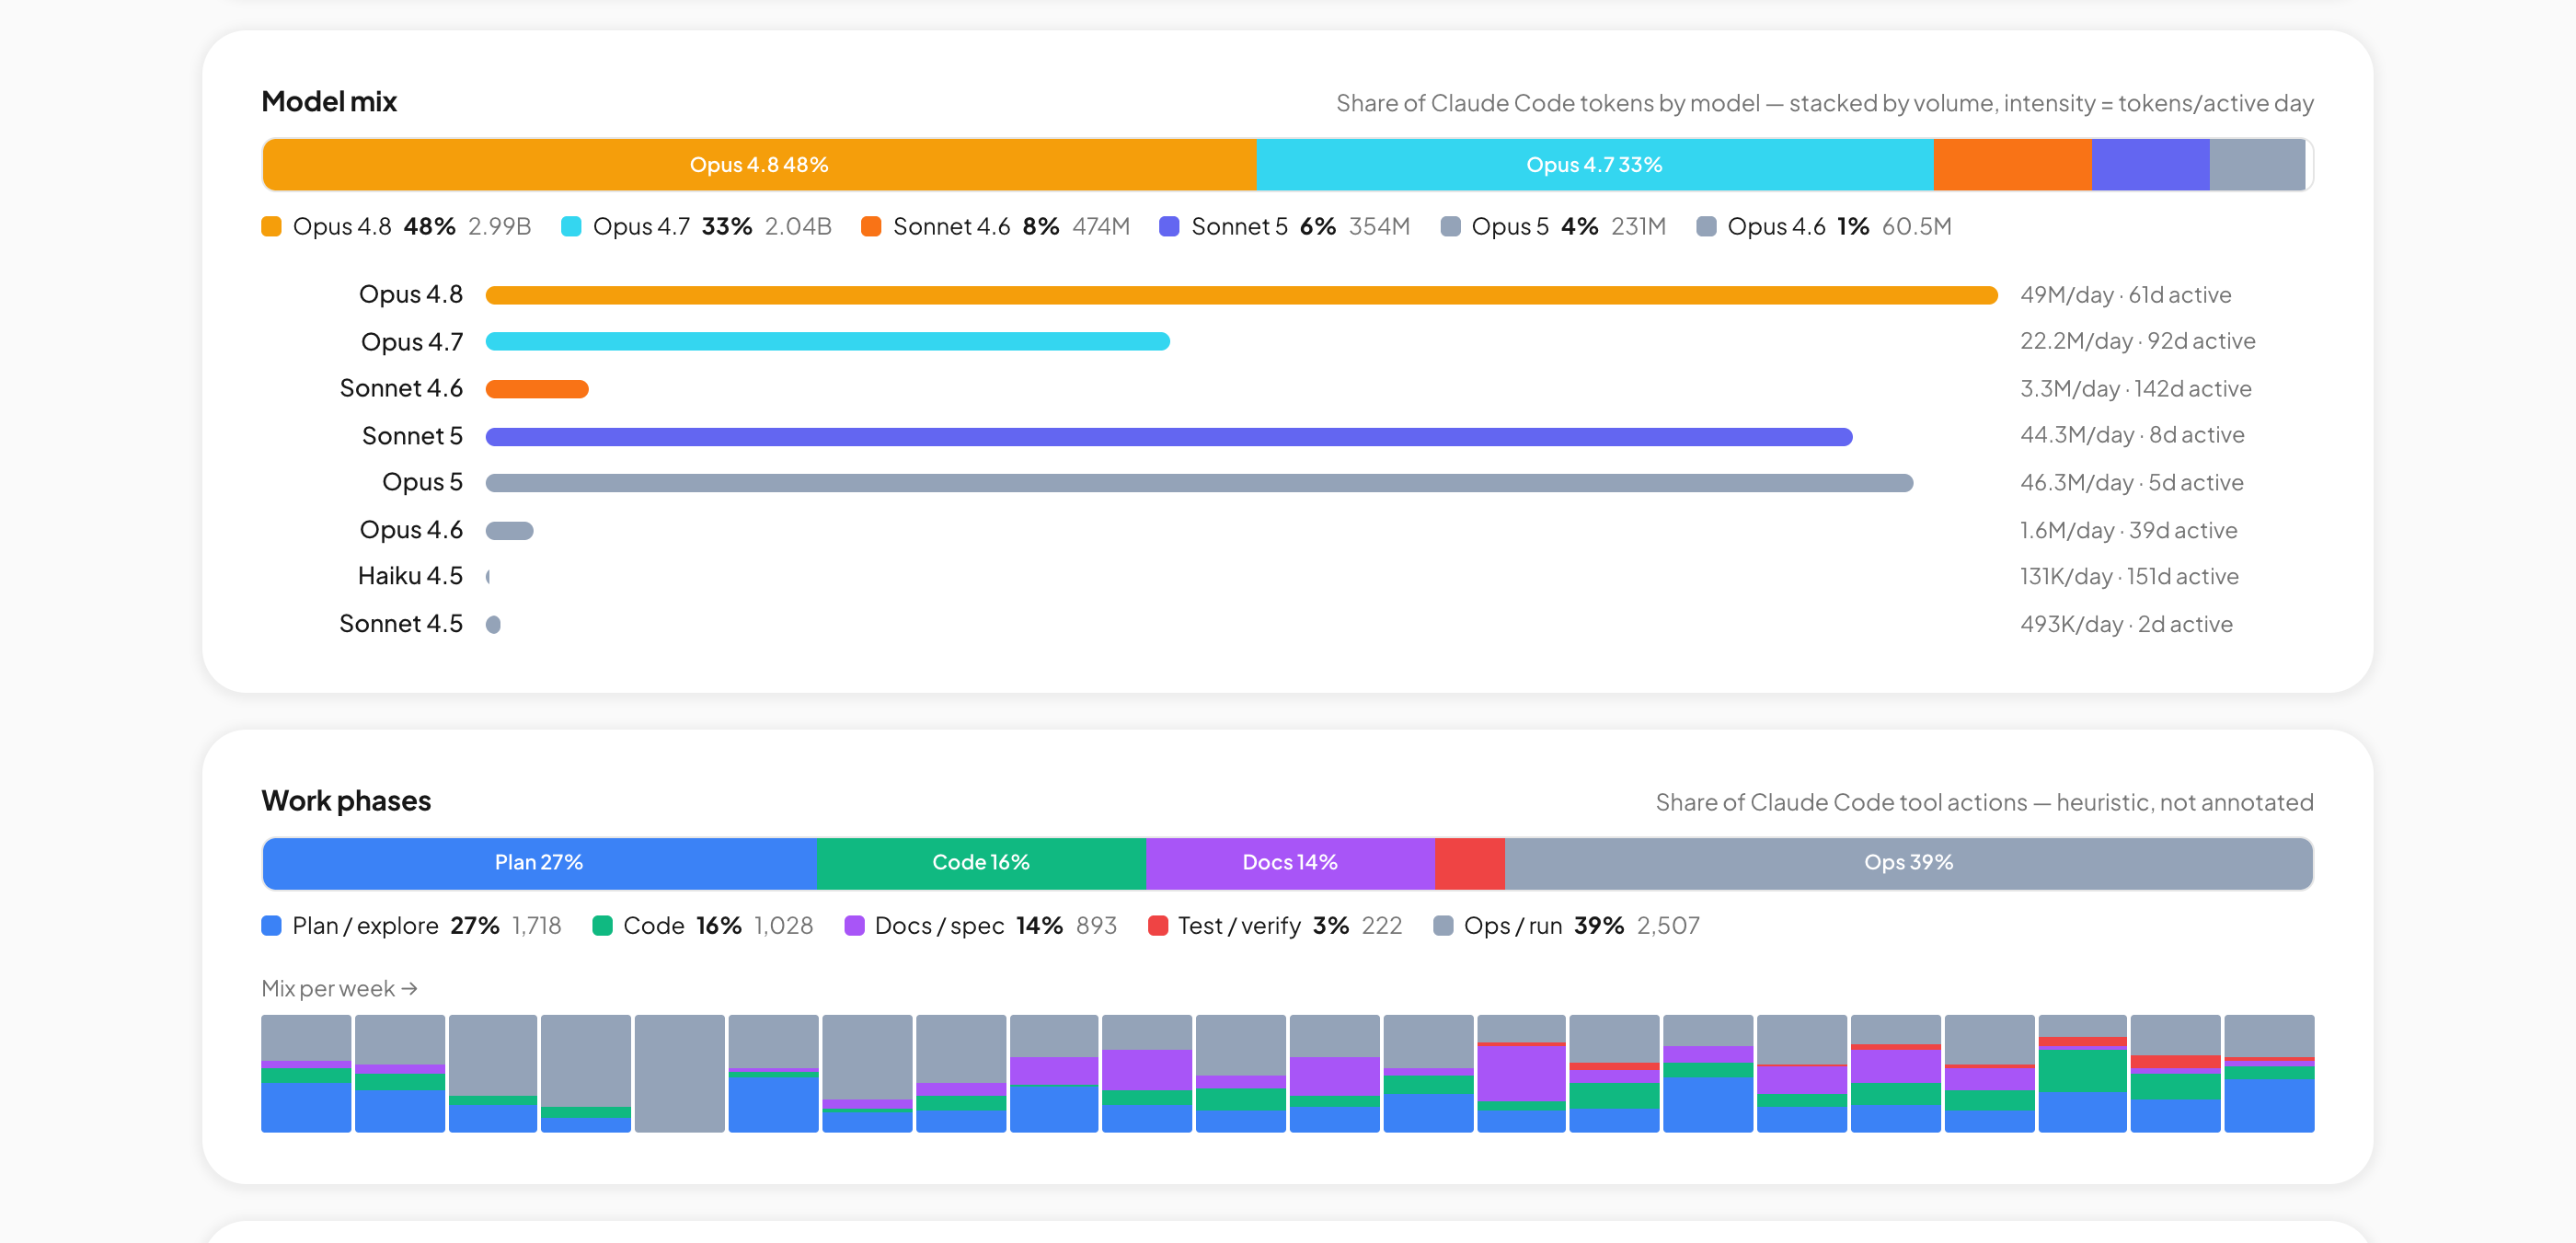
A live, running version of this - real numbers, my own usage, updated monthly: hudwahab.com/token-burn. The screenshots below are from that fuller version, which adds a few extra views on top of the basic three-lane setup above.